Data Reduction
The best way to reduce GradPak data is with IRAF and the dohydra package. If you are unfamiliar with the basics of IRAF or the general order IFU reductions with dohydra take solace in the fact that failure often leads to deeper understanding and forge ahead.
From a high-level viewpoint reducing GradPak data is no different than reducing any other IFU data, be it any of WIYN’s *Paks, Hydra, PPak, etc. etc. However, the unique, multi-pitch nature of GradPak introduces some interesting and frustrating complications that require special mention. In this guide I will breeze through aspects of reduction that are common to all IFUs and focus on the specificities of GradPak reductions.
Note
Many of the concepts and steps mentioned below, while common to any IFU reduction, are taken from the Disk Mass Survey’s SparsePak reduction recipe (link soon). I highly recommend you read this document at some point.
Below are the steps needed to go from raw frames from the bench to flux-calibrated spectra ready for analysis. Steps in italics are cruicially different for GradPak than any other IFU.
Note
Completing all the steps below will require the IRAF prompt as well as whatever Linux shell you use. I will use ‘[packagename]>’ to denote IRAF commands and ‘>’ to denote shell commands.
1. Basic Reductions
The first step is to prep your raw frames for dohydra this involves using ccdproc to trim the images and do overscan, zero, and dark corrections. You should also combine your flats (of the same exposure time) and arc images to beat down the noise. At the end of this step you should have:
- A single arc-lamp frame
- A single dome flat frame for each exposure time taken
- All of your program frames (object, standard stars, etc.) that have been trimmed, overscan corrected, and zero and dark subtracted.
Here’s a quick look at how I do this:
Overscan correct and trim all your images with ccdproc (make sure to turn of the dark, bias, and flat corrections):
ccdred> ccdproc @all_my_files.lst @all_my_files_ot.lst overscan+ trim+ zerocor- darkcor- flatcor- illumco-
        biassec=image trimsec=image interact+ order=100
Then use imstat to identify any zero frames that have strangely large standard deviations. Take these out of your master zero list. The combine all your zeros into one master zero frame:
ccdred> imcombine @culled_zeros.lst Zero.fits combine=average reject=crreject
Now subtract this master zero from all other data:
ccdred> ccdproc @all_my_files_ot.lst overscan- trim- zerocor+ darkcor- flatcor- illumcor- zero=Zero.fits
Now combine all your zero corrected dark, arc, and flat frames using imcombine. Remember to keep flats of different exposure times separate. Finally, subtract your master dark from all of your data frames. You do not need to worry about dark correcting your arc or flat frames because the exposure times are so small and the signal is so high it really doesn’t matter.
Scattered Light Corrections
You probably will want to make some correction for light that gets scattered from one aperture into another. IRAF does have a routine to do this (noao.imred.hydra.apscatter), but in practice the very tight arrangement of the GradPak slit renders it mostly useless. To deal with scattered light we have taken a zeroth order approach (which, again, given the very tight spacing, is the best we can do).
GradPak_scat provides a simple method for subtracting scattered light
from GradPak data. We average all the flux in the “gutters” (regions on the
CCD that fall outside of the slit proper) of the CCD and perform a simple
linear interpolation across the slit to get an estimate for the scattered
light at each fiber location.
The idea behind this method is that the gutters contain only scattered light
from the end fibers and are therefore decent anchors for the ends of a
scattered light function. In the absense of any knowledge of how the scattered
light actually varies with position we assume a linear function and get on
with it. Quick and simple and probably not too bad. See GradPak_scat
for more details.
2. Prepare Master Flat
Options
If you took flats at multiple exposures to get good signal across all fiber sizes then this step is cruicial. If not, skip ahead to the next step.
This step will combine your multiple flats together into a single ‘master’
flat that can be used by dohydra to apply flat-field corrections to your
data. To do this we use GradPak_flatfu, which is pretty fancy.
See GradPak_flatfu for a detailed discussion of the method and options
available; the typical usage looks a lot like:
> python GradPak_flatfu.py dFlat_4s.fits -t dFlat_1s.fits 43
This example illustrates some important descisions you will have to make based on a careful examination of your data. The first is where you want the pivot point to be. In the above example I chose fiber 43 so that the 2’’ and 3’’ fibers (1 - 43) will be taken from dFlat_4s.fits and the 4’‘, 5’‘, and 6’’ fibers (44 - 109) are taken from dFlat_1s.fits. This makes sense because in my spectrograph setup the 4’’ fibers are in the non-linear regime (don’t even ask about the 5’’ and 6’’ fibers!) with a 4s dome flat exposure while the 2’’ and 3’’ fibers have dangerously low signal with a 1s exposure. This might not be true for your data so make sure you choose a pivot point that works for you. I cannot recommend pivoting around a fiber that is not at the border of two fiber sizes.
Note
It is perfectly OK to have more than 2 different flat exposures (and
more than one pivot point). See GradPak_flatfu for more
information
The next thing you need to decide is which flat to use for doing the aperture traces. Make sure it’s a good one because the resulting traces will be used for all of your data (as they should be). By default, GradPak_flatfu will use the first flat as the trace flat, but this is often non-ideal. In the above example I used the -t flag to force GradPak_flatfu to use dFlat_1s.fits as the trace flat. In my case I first tested the traces of each flat and found that the 1s exposure flat produced trace fits that were cleaner than the 4s flat, most likely due to the wonky shape of super-saturated larger fibers. I highly recommend you do similar tests and decide for yourself which flat produces better traces.
Next, you have the option of specifying a throughput image that is used to make fiber-to-fiber corrections after extraction. Basically what IRAF does is extract the throughput image, sum each fiber along the dispersion axis, and apply a correction to normalize these sums. I strongly recommend NOT applying this correction because:
- Because of the multiple fiber sizes in GradPak this will, in principle, take your measured surface brightnesses and turn them into total intensity, which might confuse you later when you wonder why some fibers are way brighter than others.
- IRAF doesn’t even do step 1. right. Because of some rigidity in the way aperture traces are computed there will not be the simple (2:3:4:5:6)^2 ratio in brightness you might expect from the fiber sizes.
- Any variation in the throughputs of the fibers should already be captured and corrected by the dome flats. GradPak is small enough on the sky the the WIYN flat lamps should do a pretty darn good job approximating uniform illumination. Are you sure you want to use a throughput image?
All that said, if you really want to use a throughput image just precede it with the -r option.
Finally, you have a choice to remove the average flat spectrum from the master flat. This option is on by default. If selected each spectral channel of the master flat is divided by the average of that channel over all fibers. Because GradPak has multiple fiber sizes this step will not completely eliminate the spectral signature of the flat lamps, but it will greatly decrease it. At the end of the day this option is largely a matter of preference because flux calibration will remove the average flat spectrum anyway. If you want to keep the average flat spectrum for whatever reason you can turn off this option with the -nf option.
Setting up dohydra parameters
GradPak_flatfu uses the HYDRA package extensively and is highly
dependent on the parameters you set for HYDRA and dohydra in IRAF. To
access the global HYDRA parameters make sure you’ve loaded the HYDRA
package and type:
hydra> epar params
Many of these can be left as the default, but pay special attention to the TRACE PARAMETERS and ARC DISPERSION FUNCTION PARAMETERS. You can change these interactively as you fit, but after a few iterations you can save yourself some keystrokes by setting the defaults here. More important are the dohydra parameters:
hydra> epar dohydra
Leave the first section blank for now (it will be filled in by
GradPak_flatfu). Make sure your readnoise and gain are correct (this
info is in the FITS header). Fibers should be 109 and make sure apidtab =
gradpak_sizes.iraf (this is crucial for proper sky subtraction).
The width parameter is very important for aperture extraction. Before you set this open up one of your flat images (preferably the one that will be traced) with implot or imexam and measure the width of the 6’’ fibers (along the spatial dimension). These fibers probably won’t have gaussian profiles, but use the FWHM provided and your best judgement to determine an appropriate width value.
The rest of the parameters are not relevant for this step and will be covered in below.
Running GradPak_flatfu
From a user perspective, running GradPak_flatfu is identical to using
the aperture identification and extraction parameters in the HYDRA
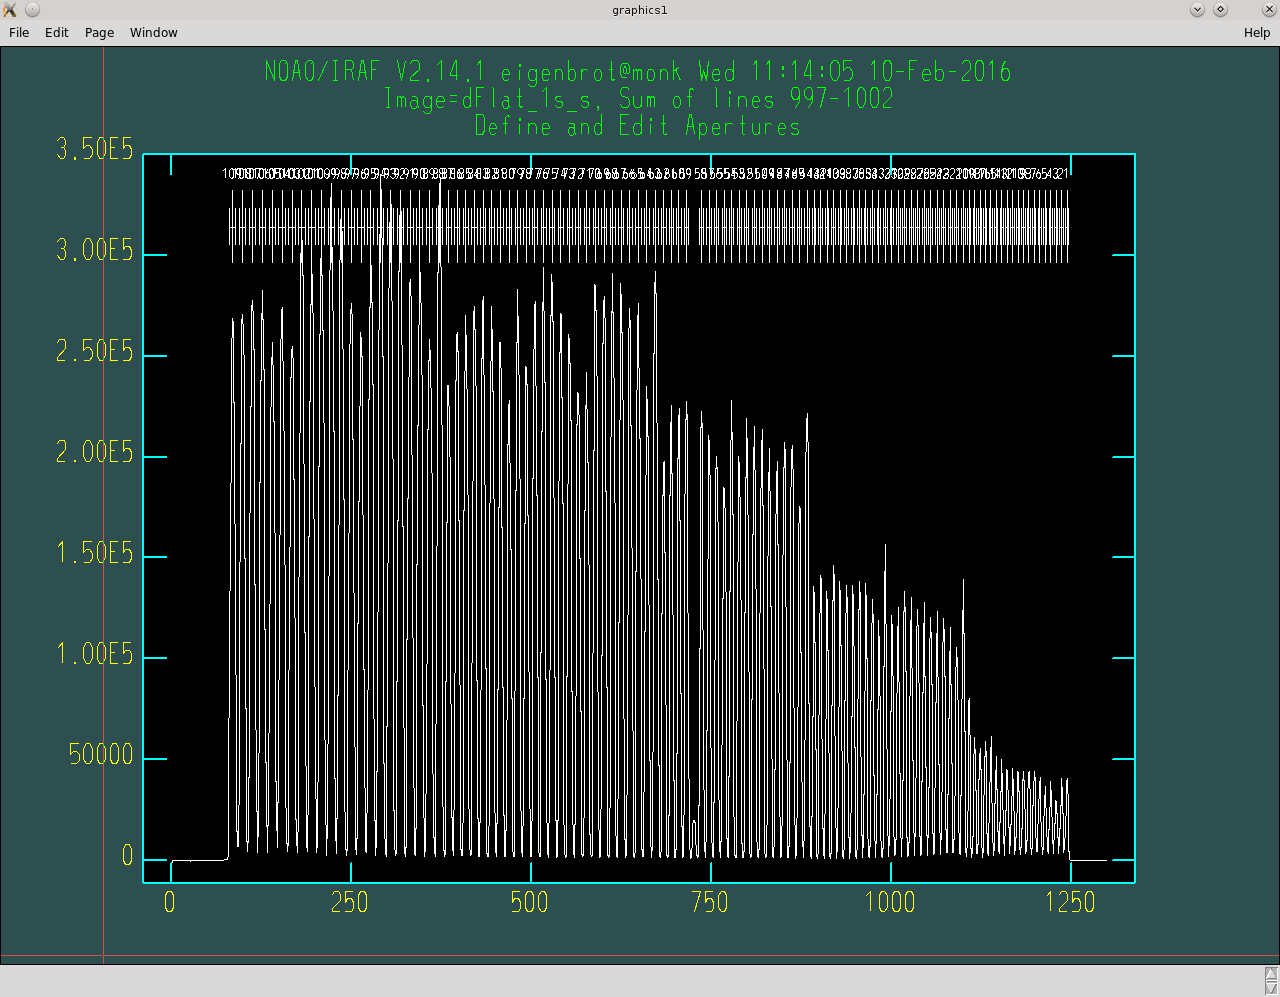
package. The first step is to identify all 109 GradPak apertures. I have never
had to adjust the aperture locations presented by IRAF, so if you find
yourself doing this you probably have some parameters set to wonky
values. Make sure you get all the way to 109 on the right side and that the
visible, but obviously broken fiber falls between 58 and 59.
Example of aperture identification. Your plot should not look very different from this.
The next step is to fit the aperture traces. I was fortunate enough to have a spectragraph setup that made this process a real pain in the ass, but maybe it will be really easy for you. The end goal is to give each aperture a trace that fits the data reasonably well. For me this meant going through all 109 apertures and adjusting the fit parameters manually to get good fits and consistent end behavior. That last point is an important one; if you have low signal at one end of your spectrum (probably the blue) you might find that the same fit parameters cause one aperture to swing wildly up at this end while the next aperture swingly wildly down. This doesn’t really make physical sense and should be avoided.
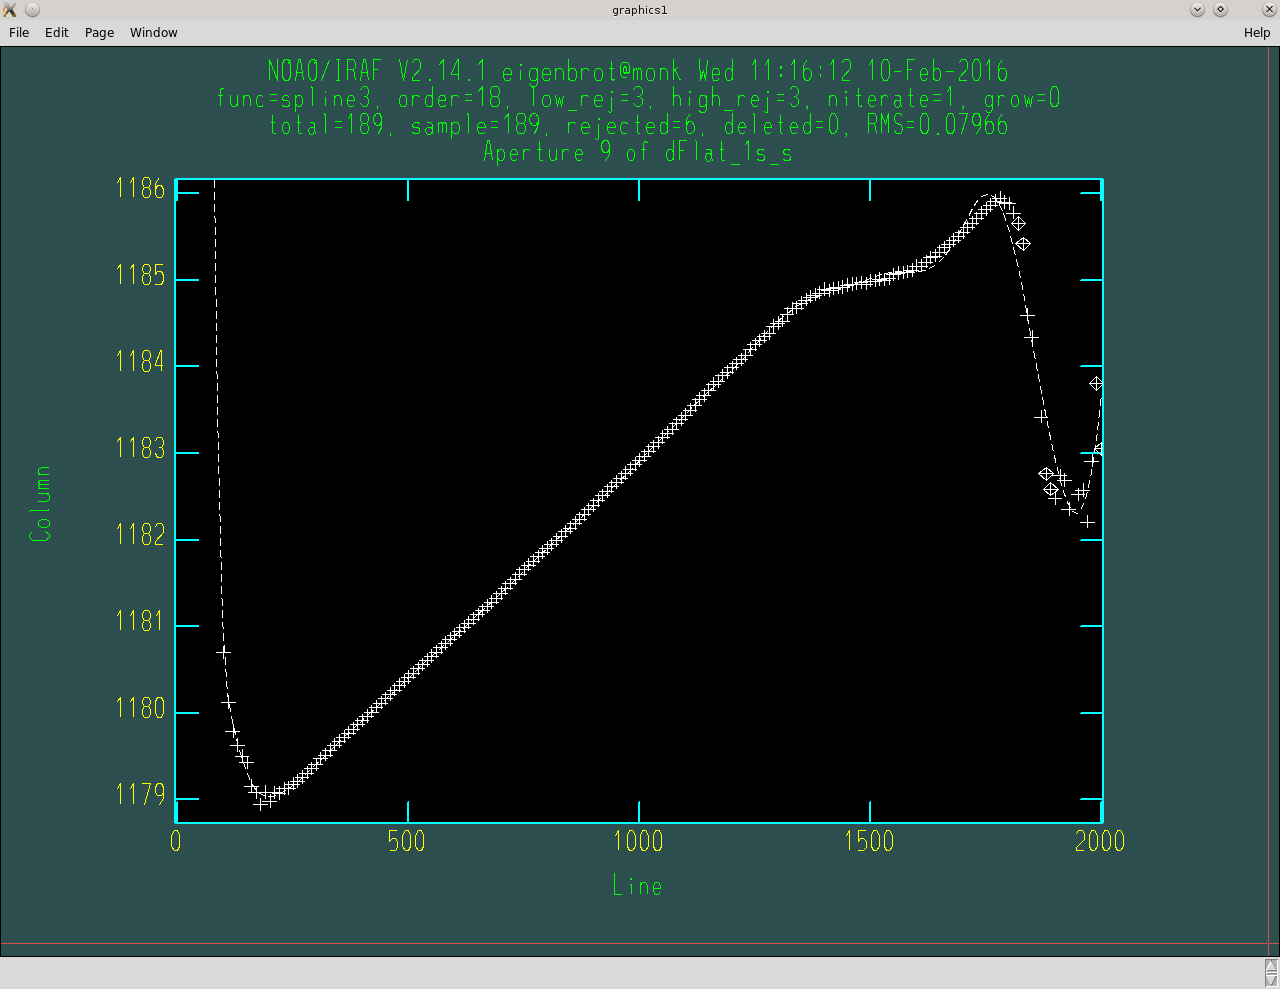
Example of fitting an aperture trace. Note the high order fit. I often have to change the fit order considerably from aperture to aperture.
Even if you get lucky and can fit all your apertures well with the same fit parameters I highly recommend monitoring the fits of all apertures at least once before you push that big ‘NO’ button.
Once all the aperture tracing is done you’ll see a few messages about
normalization and shutter correction and then the program will exit. Upon
completion GradPak_flatfu also sets all of your dohydra parameters
to be correct for the next step, which is where you should go now.
Note
GradPak_flatfu uses the same database as IRAF for storing
aperture traces, wavelength solutions, etc. This defaults to a
folder called “database” in the current directory. This means if you
mess up some aperture traces you’ll have to delete the
“database/ap*” file to start again. That said, if you just need to
rerun GradPak_flatfu for any reason (different basic
reductions or something) then you can totally skip the aperture
fitting step if the database still exists. Very nice.
3. Run dohydra
After all your hard work running GradPak_flatfu dohydra essentially
becomes a wavelength solution tool. It is important when you run dohydra
to not change any parameters except objects and arcs1. Objects will
probably be a file containing all your science frames (objects, standard
stars, etc.) and arcs1 should be the combined arc lamp spectrum you made all
the way back in step 1. You can set these using epar, but I like to just call
them directly:
hydra> dohydra @pointings.lst arcs1=Comp.fits
The first thing you will see is the spectrum of your arc lamp. I will probably be flipped in wavelenght (red on the left), but a quick ‘w’, ‘f’ will fix that problem. Your first task is to identify 4 or 5 emission lines that you know the wavelengths of. The NOAO Arc Line atlas is a good place to go if you are unsure, but hopefully you figured out a few when you were setting up the spectrograph. Place your cursor over the lines, hit the ‘m’ key to mark them and then enter the wavelegnth. Once you’re done you should have something that looks like this.
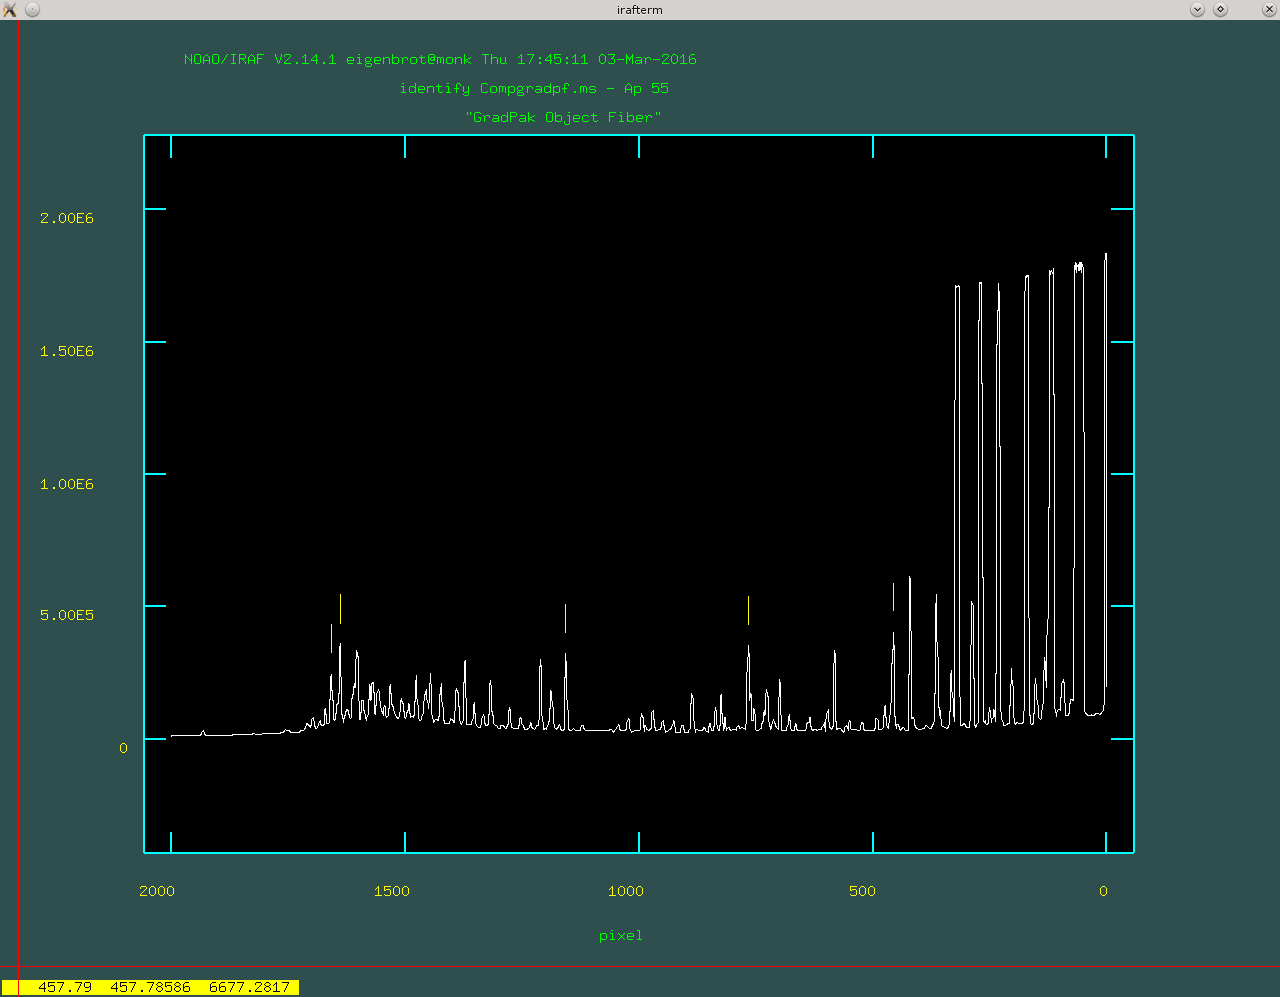
Example of marking initial set of 4-5 arc emission lines. Make sure you get these right.
Now tell dohydra to fit a solution and refine it with more lines. The first part is achieved by pressing ‘f’ to enter icfit, IRAF’s interactive curve fitter. At this point the RMS should be very low because you only have a few points, so you’ll probably just hit ‘q’ to exit the curve fitter right away.
Now press ‘l’ to load in more lines from a line list. This is where the fun begins. You will now jump back and forth between fitting (with ‘f’) and managing lines. The RMS that indicates a “good” fit varies depending on the spectrograph setup, but in general you want to eliminate and low-order trends in your residuals. The figure below shows a pretty decent fit.
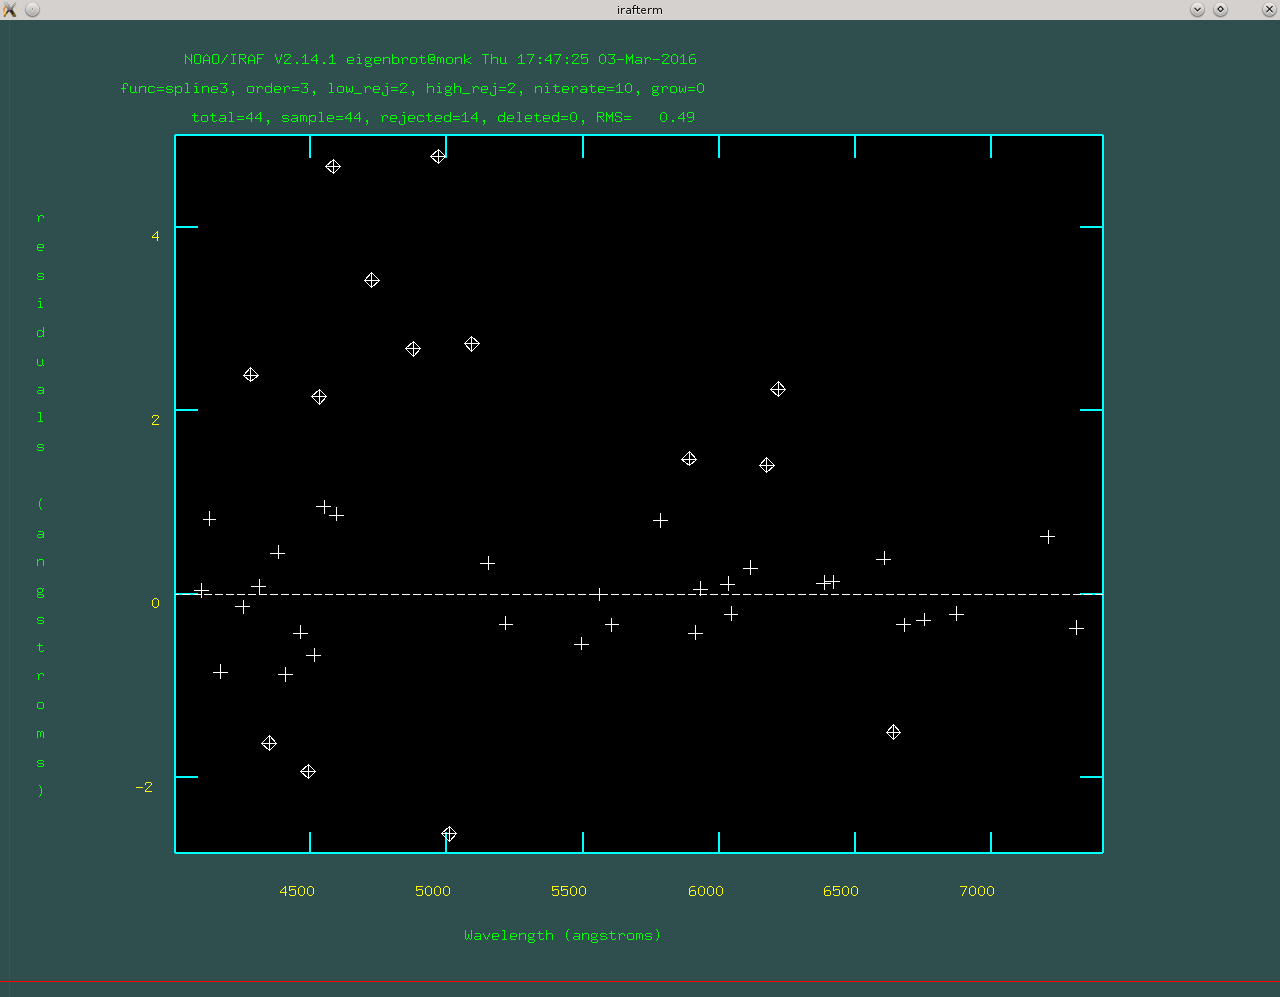
A wavelength solution after fitting and grooming the arc lines.
THIS PART IS IMPORTANT With the large fibers on GradPak it is very common to have some arc lines that are way oversaturated and it is imperitive that you remove these from your wavelength solution. Usually they will be obvious in the residual plot, but this shouldn’t stop you from, at least once, manually looking at a zoom-in of every single line begin used in the fit. Another trick that GradPak plays is that the initial fit is done on the central fiber, which is 4’‘. It is likely that some lines that are close together but perfectly distinct with 4’’ fibers are a gross blend in the 6’’ fibers. When you are marking and checking lines it is a good idea to look at the extracted 2D spectrum (.ms.fits file) and pay attention to which lines get blended in the large fibers.

An example of the perils of large fibers. The two marked arc lines would appear to be great candidates for a wavelength solution in smaller fibers, but they should be deleted from the fit because they will be very messy in the largest fibers.
Once you’ve got your fit all figured out hit ‘q’ until IRAF asks you if you want to fit the next aperture interactively. It is generally a good idea to review each fit at least once to make sure there are no blended lines messing with your solution. If there are certain lines that keep causing problems it might be worth it to start the whole process again (see note below). Once you’re satisfied that your fit is legit for all apertures you can finish the dohydra run. Depending on how you’ve setup dohydra you might have to linearize your data separately. This is done with dispcor and is really easy:
hydra> dispcor @pointings.ms.lst @pointings.ms_lin.lst w1=WAVE1 w2=WAVE2 dw=CDELT1
You don’t have to specify the exact solution (w1, w1, and dw), but it can be nice to have all of your data from different nights on exactly the same wavelength grid.
All done! You should now have a bunch of *.ms_lin.fits files ready for sky subtraction and flux calibration.
Note
If you want to start your wavelength solution from scratch simply delete the “database/id*” files in your current directory.
4. Sky Subtraction
Now that you have wavelength calibrate data and have resampled your spectra
onto a common wavelength scale you can get rid of that pesky sky signal. To do
so you will use GradPak_skysub. Torun it simply use
> python GradPak_skysub.py INPUT_FILE.ms_lin.fits [INPUT_FILE.ms_s_lin.fits]
The syntax above is just a suggestion. You can call your outputfile whatever
you want. If you choose to stick to the naming convention used throughout this
document then GradPak_skysub will take a *.ms_lin.fits file and
automatically give it a *.ms_s_lin.fits suffix.
Using GradPak_skysub is identical to HYDRA‘s skysub routine. In
face, all GradPak_skysub does is run skysub five times; one for
each fiber size.
For each fiber size you will be presented with an IRAF plot of the 4 sky fibers. In these plots you can delete specific fibers with the ‘d’ key (use ‘r’ to redraw the plot after you do this). Once you are satisified with the selection of sky fibers hit ‘q’ to be taken to the next fiber size. Once all 5 sizes are done the output file will be generated and you’re done!
5. Flux Calibration
At this point you’re basically back on the standard multispec reduction path so I won’t go into a ton of detail, but the main steps are outlined below. All of these IRAF tasks live in the NOAO.ONEDSPEC package.
Airmass Correction
You’ll need to know the atmospheric extinction to each of your frames. Fortunately the FITS headers have just about everything you need. setairmass does the rest:
onedspec> setairmass @airmass.lst
Where airmass.lst is a list of all your standard stars and sky-subtracted object frames. There are now parameters worth mentioning.
Standard Star Comparison
This step takes your standard star spectra, bins them to equal the same resolution of the library spectrum, and then computes the difference between the two. There are a few important parameters:
| extinct: | This is a file that contains extinction information for KPNO. If you did a good job with your standard star observations you’ll be given an opportunity to update this information, but the defualt file does a pretty damn good job. The default is onedstds$kpnoextinct.dat |
|---|---|
| caldir: | The location of the standard star reference library. Depending on what stars you used you’ll have a few options of libraries to use. All live in the onedstds directory. On the UW Astro computers this is /iraf/iraf/noao/lib/onedstds. Look in the directories within to find your star. IRAF has a description of where each library comes from, but I think onedstds$spec50cal is probably the best. |
| star_nam: | Hopefully it is obvious why this parameter is important. Data for this star must live in the directory specified above and must have an entry in the names.men file in that directory. |
For each standard star observation you only have one fiber illuminated so you’ll specify the aperture number why you call standard. Typically:
onedspec> standard BD284211_171_ot.ms_lin.fits std aperture=107 star_name=bd284211
Sensitivity Function
The IRAF task sensfun takes all your standard star observations and computes a wavelength and airmass dependent sensitivity response function for your instrument. The important gotchas are:
| extinct: | Set this to be exactly the same as in standard |
|---|---|
| newexti: | If you’ve got enough data to compute an extinction correction the new, corrected extinction will be written to this file. |
The other parameters can be set during fitting.
In a basic sense using sensfun is like any interactive curve fitting in IRAF; change the order and func until you are happy that the residuals have as little structure as possible. The one extra thing you can do is try fitting an extinction correction. For this you need to have standard star observations taken over a large range of airmasses, but if you do just hit ‘e’ and do some more fitting. When you’re done the program will tell you if your correction makes a significant difference to the sensitivity function fit. If you choose to save the new extinction data then it will be written to the file specified above.
Calibration
This step is really easy. The one thing to watch out for is the setting for extinct. If you made a new extinction in the previous step set it to that, otherwise keep it as onedstds$kpnoextinct.dat. The rest is really easy:
onedspec> calibrate @airmass.lst @airmass_rf.lst
That’s it. You’re all done!
A Note About Errors
Having error vectors to go along with your reduced spectra feels great and there is no reason why you should not have them. There are two ways that I have so far used to to get errors, both working best in different cases.
Full Error Propagation
Full propagation of the errors is the way to go if you do not have a lot of frames of the same sky location. This method starts from photon counting statistics and propagates these uncertainties through the entire reduction pipline. A few assumptions are made that affect accuracy for the sake of simplicity, but all in all this method works well and will give you good error estimates.
If you are using this method you will combine all of your data frames after basic reductions, but before you jump into any HYDRA functions (step 2). Then, at the end of all the reduction use mab’s rawimerr (see the SparsePak reduction guide) to get a sigma image:
ifupkg> rawimerr -INGC_891_P2.fits -o44 -b25 -nim7
and propagate this image through the GradPak pipline:
> python ~/snakes/GradPak_error.py NGC_891_P2.sig.fits
For more details see GradPak_error.
Multi-Frame Error Estimates
If you have a statistically sufficient number of single frames for each pointing/object/sky position/whatever then you can take a shortcut in the error calculations. All you do is reduce each frame separately (i.e., don’t combine individual frames before reduction) and only combine them into a single frame after all other reduction steps are completed. The standard deviation of this combination is then an accurate estimate of the uncertainties on each wavelength channel.
This method is only valid when there were no changes to the telescope/instrument system between each frame. In other words, you have to be sure that each individual frame is just a different sample of the same underlying photon distribution. If this is true then in some ways a multi-frame error estimation can be more “correct” than full error propagation because it inherently includes envirornmental factors like transparency and seeing variations; a full propagation assumes no difference to the detector input while a multi-frame estimate accepts that this input might be perturbed from its “true” value by stochastic variations in the entire system.
One last benefit of a multi-frame error estimation is that it easily accomidates the same sky position observed over multiple nights.
But enough philosophy, how do you actually get errors for this method? In it’s most basic form all you do is average your individual frames together to get the final data spectra and take the standard deviation to get the error spectra, but we can do better! Not all frames are created equal so a weighted average is often better. For weights I use the w = 1/snr^2, where “snr” comes from imexam‘s ‘m’ key in a flat part of a sky fiber (use the same fiber for all frames). imcombine takes care of the rest:
onedspec> imcombine @combine.lst NGC_891_P3.ms_rfs_lin.fits
          sigma=NGC_891_P3.me_rfs_lin.fits combine=average reject=sigclip
          weight=@ind-all-rf-P3_weights.lst scale=@ind-all-rf-P3_scales.lst
A few notes:
- You can set combine=median if you want, but if, after all the reduction steps, you still have outlying pixels then something might be wrong.
- reject=sigclip is somewhat important. Don’t use ‘avsigclip’ because, after all that reduction, your pixel values no longer follow poisson statistics
- In the above example I used the scale keyword to remove the impact of some (grey) cirrus clouds that I know intruded on a subset of data frames. You might not need this.
The last step is to take your sigma image, which is simply the standard deviation and turn it into a measure of the standard error, which is what we really care about. Simply divide by the square root of the number of frames, so if we had, for example, 11 frames the call would be:
onedspec> imarith NGC_891_P3.me_rfs_lin.fits / 3.317 NGC_891_P3.mse_rfs_lin.fits
That’s it!
IRAF Parameter List
Below is a repository of all the main IRAF tasks mentioned above and the full set of parameters I use for must reductions. DO NOT just use these blindly because your setup might necessitate significant changes. They are merely presented to give the full picture.
imclean
PACKAGE = gbupkg
TASK = imclean

imlist  =                       Input image list (template)
cleanlis=                       Ouput image list (template)
gpm     =                 none  Good pix mask (1=good; 0=bad), or none
(npasses=                    5) CR npasses param (nom. val. 5)
(fluxrat=                  8.5) CR fluxrat param (nom. val. 8.5)
(window =                    7) CR window param (nom. val. 7)
(thresho=                   5.) CR threshold param in units of stddev (nom. val. 5)
(stat_ty=            iterstats) Stddev type: iterstats, goodstats, or constant
(cstddev=                   5.) Value for user-supplied constant stddev
(nrep   =                    3) Repeat cosmic ray finding nrep times
(nneigh =                    1) Repeat adding nearest neighbors to CR map nneigh times
(nx0    =                   11) X dim of initial cleaning box (using input gpm)
(ny0    =                    1) Y dim of initial cleaning box (using input gpm)
(nxi    =                    1) X dim of CR cleaning box for nrep iterations
(nyi    =                    3) Y dim of CR cleaning box for nrep iterations
(fixall =                  yes) Repeat bad pixel fixing until all are fixed? (CRs only)
(verbose=                  yes) Print action ?
(display=                   no) Display most results for each iteration?
(interac=                   no) Use cosmicrays in interactive mode
(keepmas=                   no) Keep masks use to clean cosmicrays?
(masklis=                     ) Template of masks needed if keepmask=yes
(mylist1=           ImL9407lvb)
(mylist2=           CmL9407mvb)
(mylist3=           MmL6359drc)
(mode   =                    q)
HYDRA params
PACKAGE = hydra
   TASK = params

(line   =                INDEF) Default dispersion line
(nsum   =                    6) Number of dispersion lines to sum or median
(order  =           decreasing) Order of apertures
(extras =                   no) Extract sky, sigma, etc.?

                               -- DEFAULT APERTURE LIMITS --
(lower  =                  -5.) Lower aperture limit relative to center
(upper  =                   5.) Upper aperture limit relative to center

                                -- AUTOMATIC APERTURE RESIZING PARAMETERS --
(ylevel =                  0.3) Fraction of peak or intensity for resizing

                                -- TRACE PARAMETERS --
(t_step =                   10) Tracing step
(t_funct=              spline3) Trace fitting function
(t_order=                    3) Trace fitting function order
(t_niter=                    1) Trace rejection iterations
(t_low  =                   3.) Trace lower rejection sigma
(t_high =                   3.) Trace upper rejection sigma

                                -- SCATTERED LIGHT PARAMETERS --
(buffer =                   0.) Buffer distance from apertures
(apscat1=                     ) Fitting parameters across the dispersion
(apscat2=                     ) Fitting parameters along the dispersion

                                -- APERTURE EXTRACTION PARAMETERS --
(weights=                 none) Extraction weights (none|variance)
(pfit   =                fit1d) Profile fitting algorithm (fit1d|fit2d)
(lsigma =                   3.) Lower rejection threshold
(usigma =                   3.) Upper rejection threshold
(nsubaps=                    1) Number of subapertures

                                -- FLAT FIELD FUNCTION FITTING PARAMETERS --
(f_inter=                  yes) Fit flat field interactively?
(f_funct=              spline3) Fitting function
(f_order=                   12) Fitting function order

                                -- ARC DISPERSION FUNCTION PARAMETERS --
(thresho=                  10.) Minimum line contrast threshold
(coordli=   linelists$cuar.dat) Line list
(match  =                  -3.) Line list matching limit in Angstroms
(fwidth =                   4.) Arc line widths in pixels
(cradius=                  10.) Centering radius in pixels
(i_funct=              spline3) Coordinate function
(i_order=                    1) Order of dispersion function
(i_niter=                   10) Rejection iterations
(i_low  =                   4.) Lower rejection sigma
(i_high =                   4.) Upper rejection sigma
(refit  =                  yes) Refit coordinate function when reidentifying?
(addfeat=                   no) Add features when reidentifying?

                                -- AUTOMATIC ARC ASSIGNMENT PARAMETERS --
(select =               interp) Selection method for reference spectra
(sort   =                     ) Sort key
(group  =                     ) Group key
(time   =                   no) Is sort key a time?
(timewra=                  17.) Time wrap point for time sorting

                                -- DISPERSION CORRECTION PARAMETERS --
(lineari=                   no) Linearize (interpolate) spectra?
(log    =                   no) Logarithmic wavelength scale?
(flux   =                  yes) Conserve flux?

                                -- SKY SUBTRACTION PARAMETERS --
(combine=              average) Type of combine operation
(reject =            avsigclip) Sky rejection option
(scale  =                 none) Sky scaling option
(mode   =                   ql)
dohydra
PACKAGE = hydra
   TASK = dohydra

objects =                       List of object spectra
(apref  =                     ) Aperture reference spectrum
(flat   =    dFlat_master.fits) Flat field spectrum
(through=                     ) Throughput file or image (optional)
(arcs1  =          Comp_s.fits) List of arc spectra
(arcs2  =                     ) List of shift arc spectra
(arcrepl=                     ) Special aperture replacements
(arctabl=                     ) Arc assignment table (optional)

(readnoi=                  3.9) Read out noise sigma (photons)
(gain   =                0.438) Photon gain (photons/data number)
(datamax=                INDEF) Max data value / cosmic ray threshold
(fibers =                  109) Number of fibers
(width  =                   6.) Width of profiles (pixels)
(minsep =                   1.) Minimum separation between fibers (pixels)
(maxsep =                  10.) Maximum separation between fibers (pixels)
(apidtab= /d/monk/eigenbrot/WIYN/gradpak_sizes.iraf) Aperture identifications
(crval  =                INDEF) Approximate central wavelength
(cdelt  =                INDEF) Approximate dispersion
(objaps =                     ) Object apertures
(skyaps =                     ) Sky apertures
(arcaps =                     ) Arc apertures
(objbeam=                  0,1) Object beam numbers
(skybeam=                    0) Sky beam numbers
(arcbeam=                     ) Arc beam numbers

(scatter=                   no) Subtract scattered light?
(fitflat=                   no) Fit and ratio flat field spectrum?
(clean  =                   no) Detect and replace bad pixels?
(dispcor=                  yes) Dispersion correct spectra?
(savearc=                  yes) Save simultaneous arc apertures?
(skyalig=                   no) Align sky lines?
(skysubt=                   no) Subtract sky?
(skyedit=                  yes) Edit the sky spectra?
(savesky=                  yes) Save sky spectra?
(splot  =                   no) Plot the final spectrum?
(redo   =                   no) Redo operations if previously done?
(update =                  yes) Update spectra if cal data changes?
(batch  =                   no) Extract objects in batch?
(listonl=                   no) List steps but don't process?

(params =                     ) Algorithm parameters
(mode   =                   ql)
standard
PACKAGE = onedspec
   TASK = standard

input   =                       Input image file root name
output  =                  std  Output flux file (used by SENSFUNC)
(samesta=                  yes) Same star in all apertures?
(beam_sw=                   no) Beam switch spectra?
(apertur=                     ) Aperture selection list
(bandwid=                INDEF) Bandpass widths
(bandsep=                INDEF) Bandpass separation
(fnuzero=  3.6800000000000E-20) Absolute flux zero point
(extinct= onedstds$kpnoextinct.dat) Extinction file
(caldir =  onedstds$spec50cal/) Directory containing calibration data
(observa=       )_.observatory) Observatory for data
(interac=                  yes) Graphic interaction to define new bandpasses
(graphic=             stdgraph) Graphics output device
(cursor =                     ) Graphics cursor input
star_nam=             bd284211  Star name in calibration list
airmass =                       Airmass
exptime =                       Exposure time (seconds)
mag     =                       Magnitude of star
magband =                       Magnitude type
teff    =                       Effective temperature or spectral type
answer  =                  yes  (no|yes|NO|YES|NO!|YES!)
(mode   =                   ql)
sensfunc
PACKAGE = onedspec
   TASK = sensfunc

standard=                  std  Input standard star data file (from STANDARD)
sensitiv=                 sens  Output root sensitivity function imagename
(apertur=                     ) Aperture selection list
(ignorea=                  yes) Ignore apertures and make one sensitivity function?
(logfile=              logfile) Output log for statistics information
(extinct= onedstds$kpnoextinct.dat) Extinction file
(newexti=       n4_extinct.dat) Output revised extinction file
(observa=       )_.observatory) Observatory of data
(functio=              spline3) Fitting function
(order  =                    6) Order of fit
(interac=                  yes) Determine sensitivity function interactively?
(graphs =                   sr) Graphs per frame
(marks  =       plus cross box) Data mark types (marks deleted added)
(colors =              2 1 3 4) Colors (lines marks deleted added)
(cursor =                     ) Graphics cursor input
(device =             stdgraph) Graphics output device
answer  =                  yes  (no|yes|NO|YES)
(mode   =                   ql)
calibrate
PACKAGE = onedspec
   TASK = calibrate

input   =         @airmass.lst  Input spectra to calibrate
output  =      @airmass_rf.lst  Output calibrated spectra
(extinct=                  yes) Apply extinction correction?
(flux   =                  yes) Apply flux calibration?
(extinct= onedstds$kpnoextinct.dat) Extinction file
(observa=       )_.observatory) Observatory of observation
(ignorea=                  yes) Ignore aperture numbers in flux calibration?
(sensiti=                 sens) Image root name for sensitivity spectra
(fnu    =                   no) Create spectra having units of FNU?
airmass =                       Airmass
exptime =                       Exposure time (seconds)
(mode   =                   ql)