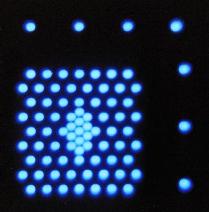
 SparsePak IFU / Performance
SparsePak IFU / Performance
SparsePak IFU / Performance | Transmission | Vignetting | Spectral Resolution |
| Focal-Ratio Degradation | Scattered Light | Sky Subtraction |
A summary of the primary results are presented here.
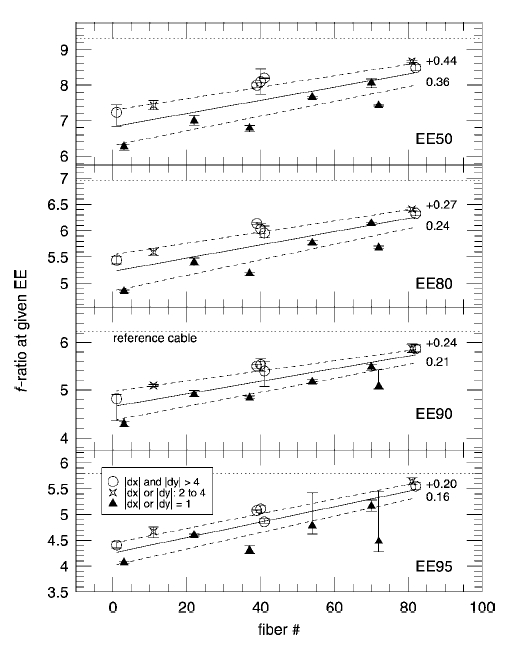 [LEFT] Relative encircled energy (EE) at an output f-ratio of f/6.3 as a
function of wavelength for 4 of the SparsePak fibers (labeled) fed
with a f/6.3 input beam. These represent four different measures of
FRD wavelength dependence for the 500 micron core Polymicro ultra-low
OH- fibers. Error-bars represent estimated observational
uncertainties. Wavelength offsets of points are for presentation
purposes. (Ref: Fig. 8, Bershady et al. 2004, PASP, 116, 565.)
[LEFT] Relative encircled energy (EE) at an output f-ratio of f/6.3 as a
function of wavelength for 4 of the SparsePak fibers (labeled) fed
with a f/6.3 input beam. These represent four different measures of
FRD wavelength dependence for the 500 micron core Polymicro ultra-low
OH- fibers. Error-bars represent estimated observational
uncertainties. Wavelength offsets of points are for presentation
purposes. (Ref: Fig. 8, Bershady et al. 2004, PASP, 116, 565.)
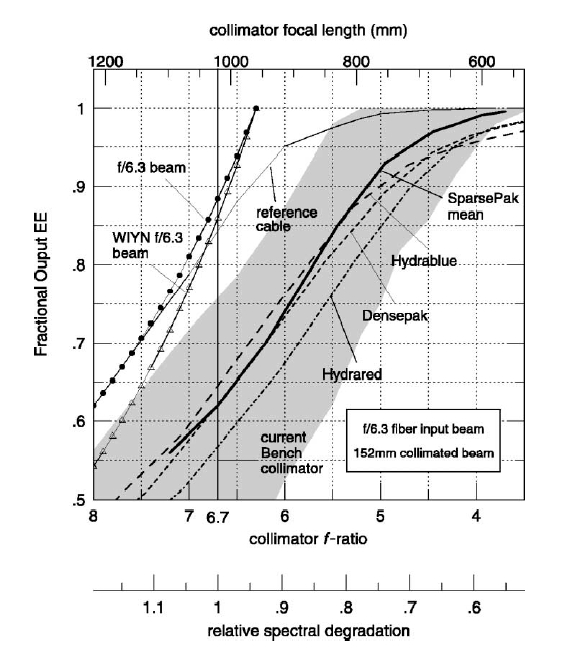 [RIGHT] Fractional output encircled energy (EE) from fibers as a function of
WIYN Bench Spectrograph collimator focal ratio (bottom axis) or
collimator focal length (top axis). This assumes a 152mm collimated
beam diameter and that all fibers are fed with a f/6.3 beam. The mean
SparsePak beam profile (thick, solid line) the range for the 13
measured SparsePak fibers (grey shaded area), and reference cable
(thin solid curve) are based on laboratory measurements (cf. Figure
15) using the f/6.3 input beam shown as a thin solid curve with solid
circles. Comparable curves, as measured {\it on the telescope} for
Densepak (300 micron fibers), and the two Hydra cables (with ``blue,''
310 micron and ``red,'' 200 micron fibers), are shown for comparison
(private communication, P. Smith & C. Conselice; see text for further
details). These measurements use the WIYN f/6.3 beam (accounting for
the central obstruction -- see text), shown as the thin solid curve
with open triangles. The very bottom scale (relative spectral
degradation) indicates how the spectral resolution of the Bench would
alter (worst case) due to changes in system demagnification as a
function of changes in the collimator focal length at fixed camera
focal length. The current Bench has a f/6.7 collimator for a 152mm
collimated beam. This figure illustrates the effects of FRD on light
losses for the Bench Spectrograph, and how optimization trades might
be made between throughput and spectral resolution for redesign of the
Bench Spectrograph collimator. (Ref: Fig. 10, Bershady et al.
2004, PASP, 116, 565.)
[RIGHT] Fractional output encircled energy (EE) from fibers as a function of
WIYN Bench Spectrograph collimator focal ratio (bottom axis) or
collimator focal length (top axis). This assumes a 152mm collimated
beam diameter and that all fibers are fed with a f/6.3 beam. The mean
SparsePak beam profile (thick, solid line) the range for the 13
measured SparsePak fibers (grey shaded area), and reference cable
(thin solid curve) are based on laboratory measurements (cf. Figure
15) using the f/6.3 input beam shown as a thin solid curve with solid
circles. Comparable curves, as measured {\it on the telescope} for
Densepak (300 micron fibers), and the two Hydra cables (with ``blue,''
310 micron and ``red,'' 200 micron fibers), are shown for comparison
(private communication, P. Smith & C. Conselice; see text for further
details). These measurements use the WIYN f/6.3 beam (accounting for
the central obstruction -- see text), shown as the thin solid curve
with open triangles. The very bottom scale (relative spectral
degradation) indicates how the spectral resolution of the Bench would
alter (worst case) due to changes in system demagnification as a
function of changes in the collimator focal length at fixed camera
focal length. The current Bench has a f/6.7 collimator for a 152mm
collimated beam. This figure illustrates the effects of FRD on light
losses for the Bench Spectrograph, and how optimization trades might
be made between throughput and spectral resolution for redesign of the
Bench Spectrograph collimator. (Ref: Fig. 10, Bershady et al.
2004, PASP, 116, 565.)